Proactive Urban Planning: A Data-Driven Approach
Our platform is engineered to transition public health management from reactive to proactive. By using advanced analytical models, it integrates climate, socio-demographic, and infrastructure data to evaluate the risk of disease outbreaks like dengue. The system helps health officials identify key risk thresholds, enabling effective early warning systems and preventative strategies.
Proactive Management: From Prediction to Action
The platform enables a fundamental shift from a reactive to a proactive approach to public health. Instead of merely responding to confirmed disease cases, our system uses predictive intelligence to act as a sentinel, identifying and quantifying risk long before an outbreak reaches a critical stage. This is achieved through:
Risk Quantification: The platform's models don't just predict the number of cases; they generate a normalized risk index that serves as an early warning system for health authorities. This index allows for the targeted allocation of resources to the most vulnerable municipalities.
Actionable Insights: The system reveals the "why" behind the risk. By integrating a wide range of variables, it pinpoints the critical socio-ecological factors, like population density and piped water availability, that modulate an outbreak's severity. This intelligence allows for interventions to be planned and executed with precision.
By providing a comprehensive view of the risk landscape, our platform empowers public health officials to get ahead of the curve, enabling a preventative strategy that is both more efficient and more effective in safeguarding urban communities.


How to Use the Dengue Risk Model
Our platform makes it simple to analyze and forecast dengue risk by integrating multiple data points. Here's a step-by-step guide on how to use the interface.
Step 1: Select Your Location and Input Data
You can start by selecting a specific municipality on the interactive map. Alternatively, you can manually input the relevant data points on the Sociodemographic Impact Model page.
The model requires three categories of information to generate a report:
Demographic Inputs: These variables include data like population density or the number of inhabitants by age group.
Infrastructure & Environment: This includes crucial factors like drainage level and solid waste management.
External Factors: This is where you input the Combined Climate Risk Index, which accounts for climatic conditions like temperature and humidity.
Step 2: Generate and Analyze the Risk Report
Once you've entered all the required data, click the "Generate Risk Report" button. The platform will process the information using its Gradient Boosting model to generate a Dengue Risk Report.
The report provides a Risk Breakdown that shows how the different factors contribute to the overall risk level. For example, while climate is the primary driver, the model has shown that population density and access to piped water are critical modulating factors that determine the severity of an outbreak.
Step 3: Review Recommended Actions
Based on the generated risk score and the breakdown of contributing factors, the platform provides a list of Recommended Actions. This actionable guidance helps public health officials implement proactive strategies, such as targeted vector control or improvements in sanitation infrastructure, to mitigate the risk of an outbreak before it occurs.
Findings
A summary of our data analysis, highlighting the key patterns and relationships that inform our predictive model.
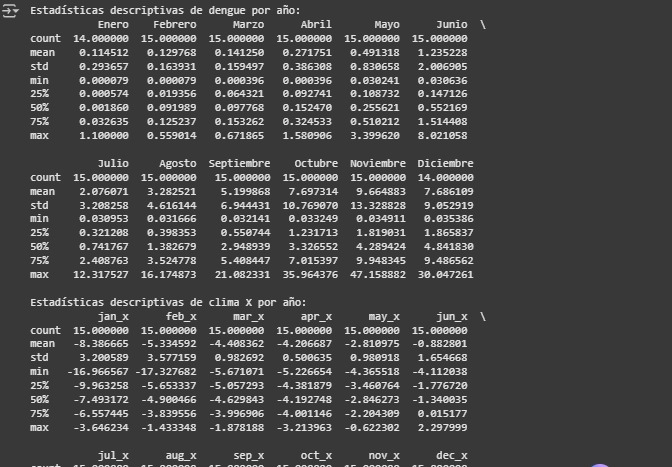
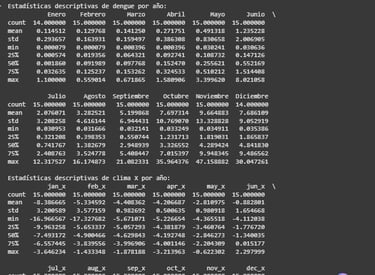
Statistical Breakdown of Dengue Seasonality
A detailed look at the descriptive statistics reinforces the seasonal trend. The `mean` and `max` values for dengue cases escalate dramatically in the later months, particularly from September to November. This view quantifies the risk, moving beyond visual patterns to hard numbers that show a significant rise in the severity of peak outbreaks.
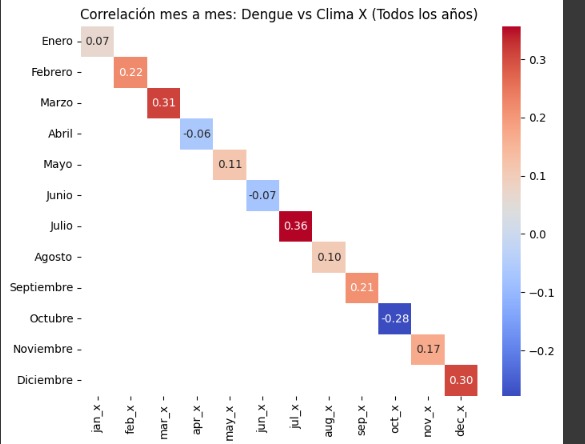
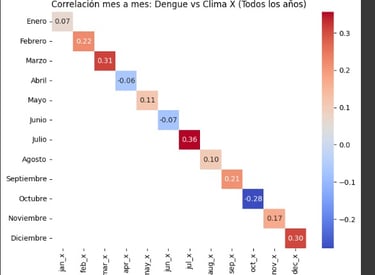
The Insufficiency of Simple Climate Models
Although a relationship exists between climate and dengue, our correlation analysis shows that a model based on a single climate variable is insufficient to predict outbreaks. Direct month-to-month correlations are weak and fail to capture the complexity of the phenomenon. This justifies the need for our Machine Learning approach.
Uncovering Dengue's Hidden Patterns
Our results show that dengue transmission is driven by complex non-linear interactions between climate variables, highlighting minimum temperature and its temporal lags. This technical analysis, using NASA data, quantifies the impact of each factor and proves why advanced models are essential for accurate prediction.
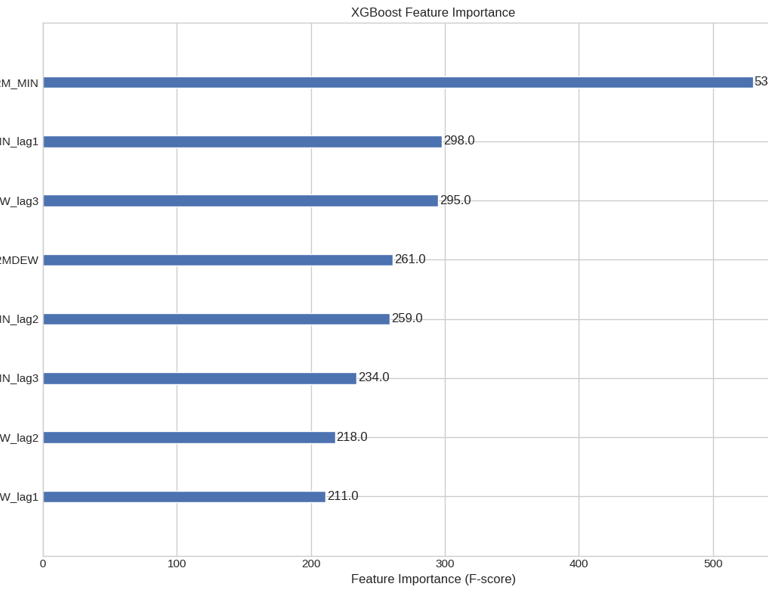
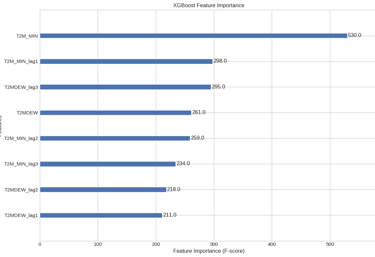
Identification of Critical Variables with XGBoost
Our XGBoost model identifies and ranks the variables with the greatest predictive power. The minimum temperature (T2M_MIN) and its temporal lags emerge as the most influential predictors. This finding, obtained from NASA data, is crucial for understanding which specific environmental conditions contribute most to the vector's proliferation.
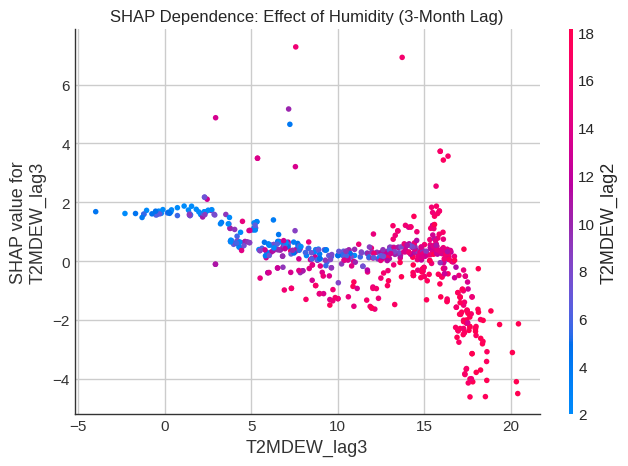
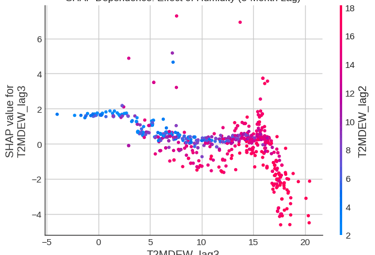
Deconstructing the Complex Role of Humidity
This SHAP dependence plot isolates the effect of humidity with a 3-month lag (T2MDEW_lag3). It reveals a significant non-linear relationship where high levels of humidity unexpectedly correlate with a lower predicted risk of dengue. Furthermore, the color, representing humidity with a 2-month lag (T2MDEW_lag2), shows a clear interaction effect. This demonstrates the model's capacity to learn nuanced environmental dynamics that would be invisible to simpler analytical methods.