From Climate Risk to Economic Insight
An interactive platform that translates NASA satellite data into strategic financial decisions for the agricultural sector.
Module: Food Security for Smart Cities
Food security is a fundamental pillar of urban quality of life; a city cannot be healthy or prosperous if its inhabitants lack sufficient and stable access to food. The challenge intensifies as cities grow, since urban expansion often consumes surrounding farmland, creating a dangerous paradox: the larger the population, the lower the local capacity to feed it. This problem is further exacerbated by the effects of climate change, such as droughts and extreme temperatures, which introduce unprecedented volatility in agricultural production and threaten supply chains.


How It Works: Your Guide to the Platform
Step 1: Select Your Area of Focus
First, choose the module that aligns with your needs. The platform offers a comprehensive analytical portfolio. You can select a model based on your area of interest:
Food Security for Smart Cities: This module focuses on the agricultural sector, where you can analyze the vulnerability and yield of crops like corn, cucumber, and chili.
Eco-Epidemiological Model: This is for public health and helps you understand and predict risks like dengue transmission.
Urban Infrastructure Resilience: This module allows you to evaluate the resilience of urban infrastructure to climatic stress.
Step 2: Choose Your Analytical Tool
Once you've selected your focus, the platform provides you with a suite of analytical tools to explore the data. For the "Food Security" module, you can access:
Yield Simulator: This tool uses an advanced model to simulate the impact of various climate conditions on crop yield. You can adjust sliders for factors like Climate Stability, Wind Profile Stability, and Water Availability to generate a report.
Risk Assessment: This allows you to quantify climate risk using synthetic indices like the Prime Condition Index (ICP) and the Stress Index (ISEC). These indices translate climatic patterns into measurable risk metrics for economic decision-making.
Economic Briefing: Here, you'll find an economic discussion that connects climate volatility to key economic indicators like the National Consumer Price Index, helping you anticipate potential supply shocks and inflationary pressures.
Step 3: Interpret Your Results
The platform is built on a foundation of interpretable models, meaning you don't just get a prediction—you understand the "why" behind it.
Dashboards & Reports: The Field Command Center gives you a snapshot of daily operations with real-time priority alerts based on factors like weather forecasts and crop stage.
Climatic Archetype Analysis: For a deeper dive, our Archetype Analysis tool uses a K-Means algorithm to discover "climatic signatures" and quantify the economic vulnerability of a season. This analysis revealed that the "Prime" archetype yielded up to 35% more than the "Catastrophic" one.
Variable Importance: The models also show which variables are most critical. For example, the
Attention Mechanism of the model for cucumber assigned the highest importance to the months in the vegetative phase , while for urban infrastructure,
Downward Longwave Radiation was found to be the most influential factor for drainage capacity. This allows you to pinpoint the most critical moments for intervention.
From the Field to the Economy:
Synthetic Indices and Macroeconomic Impact
To measure the true scope of climate volatility, it is essential to connect our predictive analyses with key economic indicators. This is where our synthetic indices, such as the "Prime" Condition Index (PCI) and the Stress Index, become strategically relevant. These indices not only quantify risk at the plot level but also act as a bridge to the macroeconomy, allowing climate to be modeled as an asset (a high PCI) or a liability (a high Stress Index) on the agricultural sector's economic balance sheet.
This connection becomes tangible when analyzing its correlation with the National Consumer Price Index (NCPI), the official indicator of inflation. Variations in agricultural production, anticipated by our indices, are a fundamental driver of changes in food prices, which in turn have a significant weight in the NCPI. Therefore, our models act as an early warning system for potential supply shocks, allowing central banks and finance ministries to anticipate inflationary pressures. This ability to "put a price" on the climate externality creates a solid empirical basis for designing more effective public policies and for developing innovative financial instruments, such as parametric insurance, that protect both producers and the economy at large


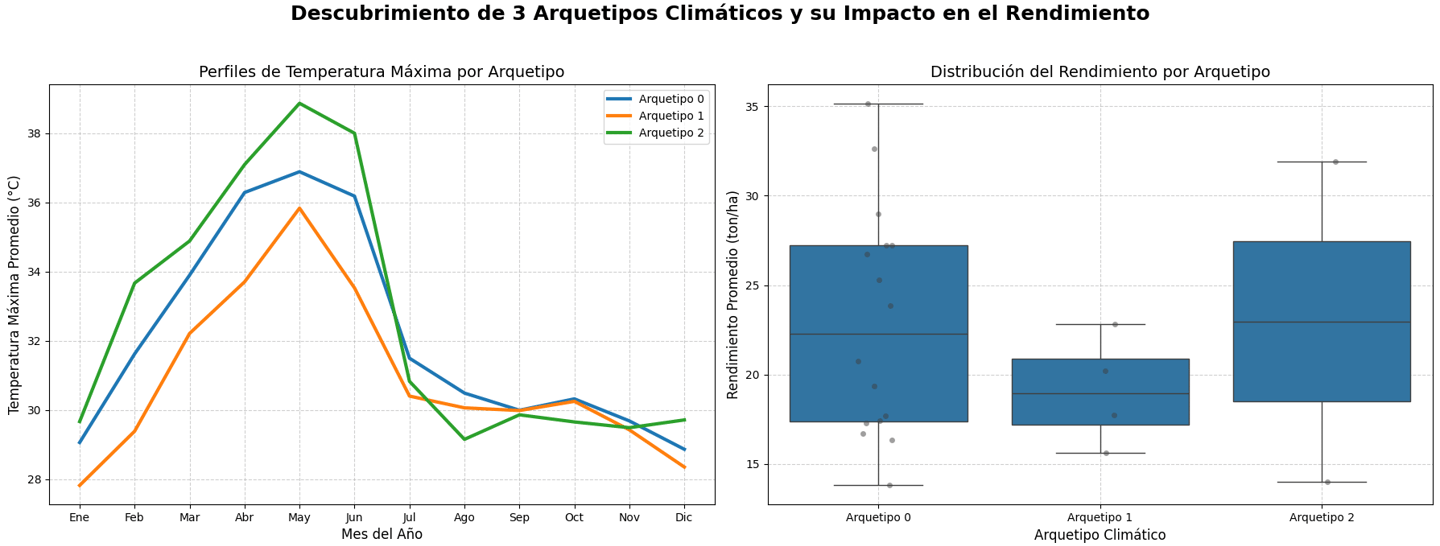
Discovery of 3 Climatic Archetypes and Their Impact on Yield
The analysis of "climatic archetypes" goes beyond simple correlation to uncover systemic climate patterns or "signatures" that impact agricultural yield. The K-Means algorithm identified the existence of four distinct climatic archetypes for corn cultivation: "Prime," "Stable," "Adverse," and "Catastrophic". The average yield in the "Prime" archetype was up to 35% higher than in the "Catastrophic" archetype. This finding is not just a statistic, but a quantification of the agricultural sector's economic vulnerability.
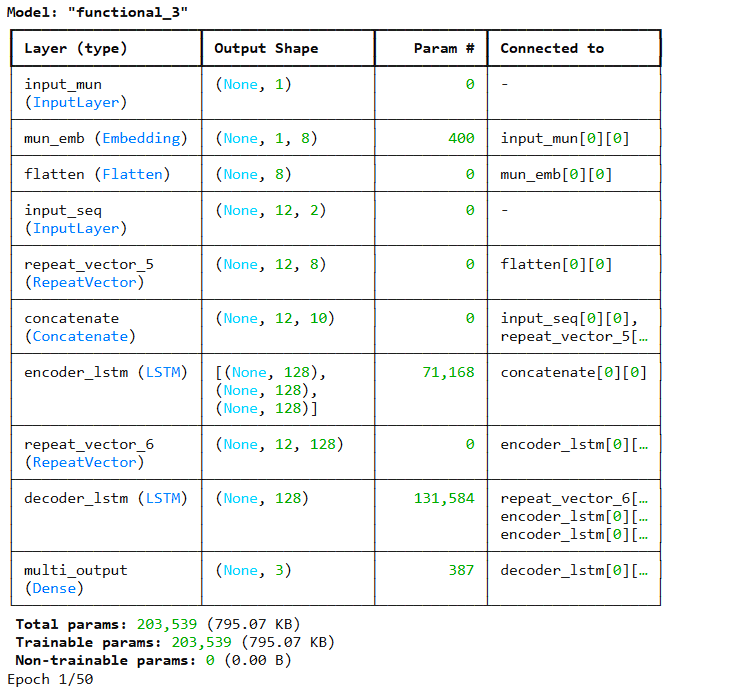
Solutions of Hybrid Analysis
Instead of relying on a single source of information, our advanced modeling architecture integrates data from multiple origins to offer more accurate and contextualized predictions. The "functional_3" Model is designed to combine the static information of a location (such as the characteristics of a municipality) with the time series of data (such as monthly climatic measurements).
This integration is possible thanks to an architecture of interconnected layers:
The input_mun layer receives the municipality data, which is converted into a feature vector through the mun_emb layer.
In parallel, the input_seq layer processes the sequential data, such as the 12 months of climatic measurements.
The magic happens in the concatenate layer, which intelligently joins these two data streams, allowing the model to understand the influence of local conditions on temporal trends.


The Agricultural Credit Simulator
In an era of increasing climate volatility, making sound financial decisions is the cornerstone of agricultural resilience. A credit simulator acts as a strategic flight simulator for farmers and financial institutions, allowing them to test investment and credit scenarios against a range of potential climate futures without risking capital. By translating complex yield predictions into tangible financial outcomes, this tool empowers users to quantify risk, optimize resource allocation, and design credit products that are both profitable and sustainable. It transforms uncertainty from an overwhelming obstacle into a manageable variable, fostering a more secure and predictable financial environment for the entire agricultural value chain.
The true power of our simulator lies in its intuitive user interface, specifically designed as a support tool for producers. It acts as the crucial bridge between complex climatological forecasts and on-the-ground economic decision-making. The platform leverages our analytical engine to translate high-precision yield forecasts and climate risk archetypes into cash flow projections, loan viability assessments, and a "climate-adjusted" default risk calculation. This not only empowers the producer but also allows financial institutions to move beyond traditional credit scoring to offer fairer, more precise financing. For policymakers, it provides an empirical basis for designing smarter subsidies and insurance programs, ensuring that financial support is deployed effectively to build a truly resilient agricultural sector.